Today’s (November 29, 2023) GDP release (Q3 2023, Second Estimate) was accompanied by the Bureau of Economic Analysis (BEA) Corporate Profits report (Preliminary Estimate) for the 3rd Quarter.
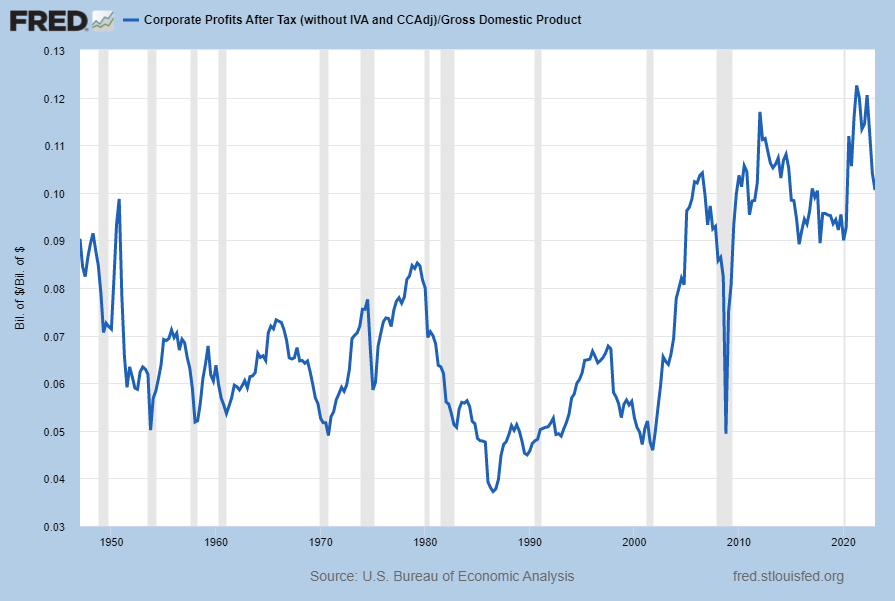
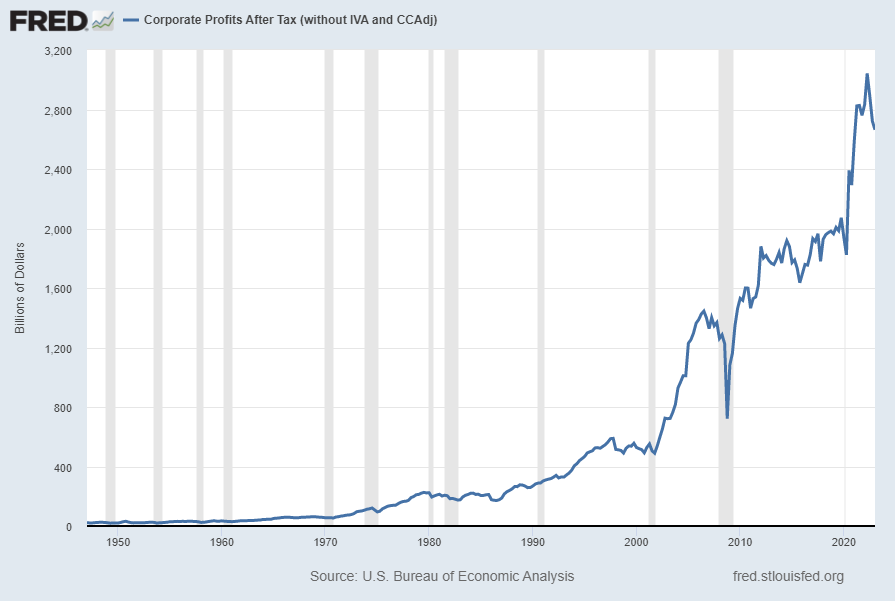
Of course, there are many ways to adjust and depict overall Corporate Profits. For reference purposes, here is a chart from the St. Louis Federal Reserve (FRED) showing the Corporate Profits After Tax (without IVA and CCAdj) (last updated November 29, 2023 with a value of $3,029.065 Billion SAAR):

–
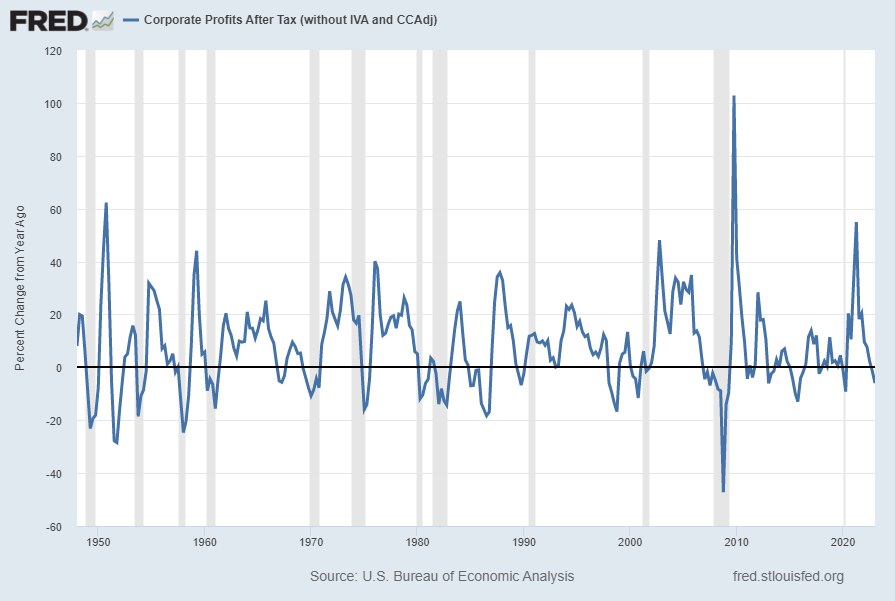
Here is the Corporate Profits After Tax measure shown on a Percentage Change from a Year Ago perspective (value of .5%):

Data Source: FRED, Federal Reserve Economic Data, Federal Reserve Bank of St. Louis: Corporate Profits After Tax [CP]; U.S. Department of Commerce: Bureau of Economic Analysis; accessed November 29, 2023; https://research.stlouisfed.org/fred2/series/CP
_____
RevSD, LLC offers the above data and projections for informational purposes only, and does not necessarily agree with information provided by these outside parties.
—–
ProfitabilityIssues.com is published by RevSD, LLC (RevSD.com). RevSD, LLC is a management consulting firm and strategic advisory that focuses on the analysis of current and future business conditions, and given these conditions, offers corporations and businesses advice, strategies, and actionable methods on how to optimally increase revenues and profitability.